Beginner's Guide: Debug Python Code on VS Code
Hello Guys,
Once again, I am here with my blog post on how to
debug Python code on VS Code editor. If you remember, we have discussed how to
use VS Code for Python from its installation to run a simple Python "HelloWorld" program in my previous blog, so now
we are going to get acquainted with the debugging feature of VS Code for
Python. Please note that this does not cover all the features extensively, but enough to get started with (Beginner's guide... 😃)
Let's get started:
Before starting debugging we need to take care of
few things like setting our debugging configurations specifically for Python.
So, let’s do this first by following the steps below:
Initialize configurations:
A configuration drives VS Code's behavior during
a debugging session. Configurations are defined in a launch.json file that's
stored in a .vscode folder in your workspace (your project folder).
To initialize debug configurations, you need to select
the Debug View icon in the activity bar as shown in pic:
 |
| Debug View Icon |
If you don't yet have any configurations defined,
you'll see "No Configurations" selected in the debug drop-down list,
and a dot on the settings icon:

Now we need to generate a launch.json file with
Python configurations, by following the steps given below:
1. Select the settings button (circled in the image above) or use the Debug
> Open configurations menu command.
2. In the Select Environment drop-down list that appears, select Python.
3. The Python extension then creates and opens a launch.json file that
contains number of pre-defined configurations. You can modify configurations
(to add arguments, for example), and also add custom configurations.

Now once
again click on the Debug View in the activity bar and then select the
preferable option from the drop-down list:

By default, VS Code shows only the most common
configurations provided by the Python extension. You can select other
configurations to include in launch.json by using the Add Configuration
command shown in the list and in the launch.json editor.

Now you can see as shown on status bar, your
selected debugging configuration. Selecting the configuration brings up a list
from which you can choose a different configuration:


This is how
a debug pane would look like where will see various sections to help you track information while you are running your program/script in debug mode. Believe me, this feature can really help us debug
our python code effectively and efficiently:

Run the
Debugger:
Let’s start
our debugging on the previously created the simple Hello world program file hello.py
First, set a breakpoint on line 2 of hello.py by
placing the cursor on this line and pressing F9. Alternately, just click in the
editor's left gutter, next to the line numbers. When you set a breakpoint, a
red circle appears in the gutter.

As you can see in the pic:

Switch to hello.py in the editor, then run the debugger
by selecting the arrow in the Debug toolbar or pressing F5. Once the breakpoint
is hit, your code execution stops right before executing that line and the
debug toolbar appears at the top in the center as shown in pic:

A debug toolbar appears along the top with the
following commands from left to right: continue (F5), step over (F10), step
into (F11), step out (Shift+F11), restart (Ctrl+Shift+F5), and stop (Shift+F5).
1. continue (F5): Clicking continue will execute the entire code until
the next breakpoint is hit or the program ends.
2. step over (F10): Clicking step over will execute one line of code. If
the line contains a function then that function will be executed and we will
get the result without debugging the each line in that function (just the
result of that function call).
3. step into (F11): Clicking step into will behaves exactly as the step over if the line is not the
function, but if it’s a function then debugger will enter that function call
and execute line by line debugging in that function.
4. step out (Shift+F11): Clicking step out will execute rest of the function, in which you are in currently, and return back to that
line where the function was called, basically it’s a way out from a function after executig rest of the lines in that function.
5. restart (Ctrl+Shift+F5): Clicking restart will start the debugging
again.
6. stop (Shift+F5): Clicking stop will stop the debugging.
Once your breakpoint is hit, clicking “Step over” will execute one line of
code. If that line is a function call, the complete function code would execute
in one “step over” click, unless you
have a breakpoint set in that function too. You can analyze your program state
by going through the value of the local variables (Variables section in the debug pane). If you examine the Local
variables window at this point, you see that only automatic dunder variables
are defined:

While you are debugging you code, you can see
relevant output in terminal.

Now let's move over to a different python program
of printing a pattern so that we can analyze the change in value of the
variables when they are used in a loop statement.
Let’s try this out by writing the simple python
code in the VS Code editor. Create a new file and save it as pattern.py and
write this code.

Set a breakpoint on the required line:

Start debugging (F5)
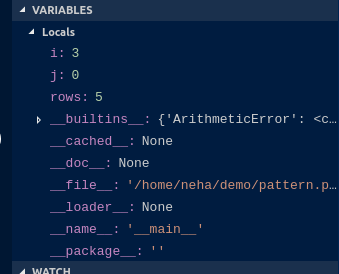
Note that we are only seeing value of "rows'
in the Variables section below, as the breakpoint was hit for the first time
and we do not have any other local variable in this context right now.

You can continue with debugging using the Step
Over button and when our breakpoint is hit, you have your dunder variables
along with your local variables (i and j) in the variable section of the debug
pane with their current value.

In case you have a number of local variables that
you need to track while stepping in you code, you can use the watch section in
the Debug pane to just add the required variables. Please note that, these will
still be available in Variables section. The watch window will have just
selected few variables that you add and want to track easily instead of
scrolling through a number of entries in the Variables section.


In the next pic you can see the change in the
values of “i and j” as we parse our loop.


So this all for now, these are the basic
information which is required to get you started with efficient debugging of code. For a deeper
understanding you can go through the official Microsoft Documentation .
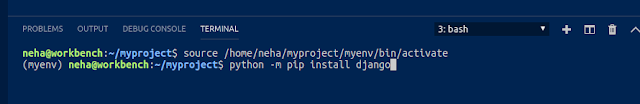
Bye for now, I will be back soon with my next
blog" Beginner’s Guide: Setting up the virtual environment in VS Code for different Python-based projects" .Till then keep quenching your thirst for CODE... Thanks for your valuable time. Have a nice day :-) 😄
Note: THE INFORMATION PROVIDED IN THIS POST IS "AS IS" WITHOUT WARRANTY OF ANY KIND.

Easy to follow.
ReplyDelete